Reports and statistics
Within ATS Recruitis, you can view two items related to reporting in the Selections menu:
The purpose of the statistics is to give recruiters a quick overview of the key recruitment KPIs directly in the application in the form of graphs, while the reports are a comprehensive set of data intended for further or deeper analysis in XLSX format.
Statistics
Statistics give recruiters an overview of the KPIs we consider essential for recruitment. They are displayed in the form of interactive charts.
The KPIs that the statistics track are:
- Number of candidates and their resources
- Length of recruitment
- Reasons for rejection
- Gender of candidates
The statistics can be filtered according to the period, the name of the recruiter and, above all, according to the recruitment flow, or recruitment process templates, that you use for your positions. This is due to the fact that, for example, "length of recruitment" statistics cannot be mixed from multiple recruitment processes (it is logical that a three-round interview takes longer than a two-round one, and you don't want it to affect your numbers). This is also important to consider when creating a recruitment flow - there are scenarios where, even if you have de facto the same recruitment process, it is better to set up flow two so that the statistics give you relevant numbers. E.g. if you are looking for positions in marketing and development according to the same process, it will be better to have flow two for the sake of tracking resources - for example, job portals will work for you for marketing, but they will not put relevant candidates into development. If you were to mix both into one flow, you would find that jobs are a source that brings a large percentage of candidates to development, or you wouldn't be able to tell which candidates the jobs represent.
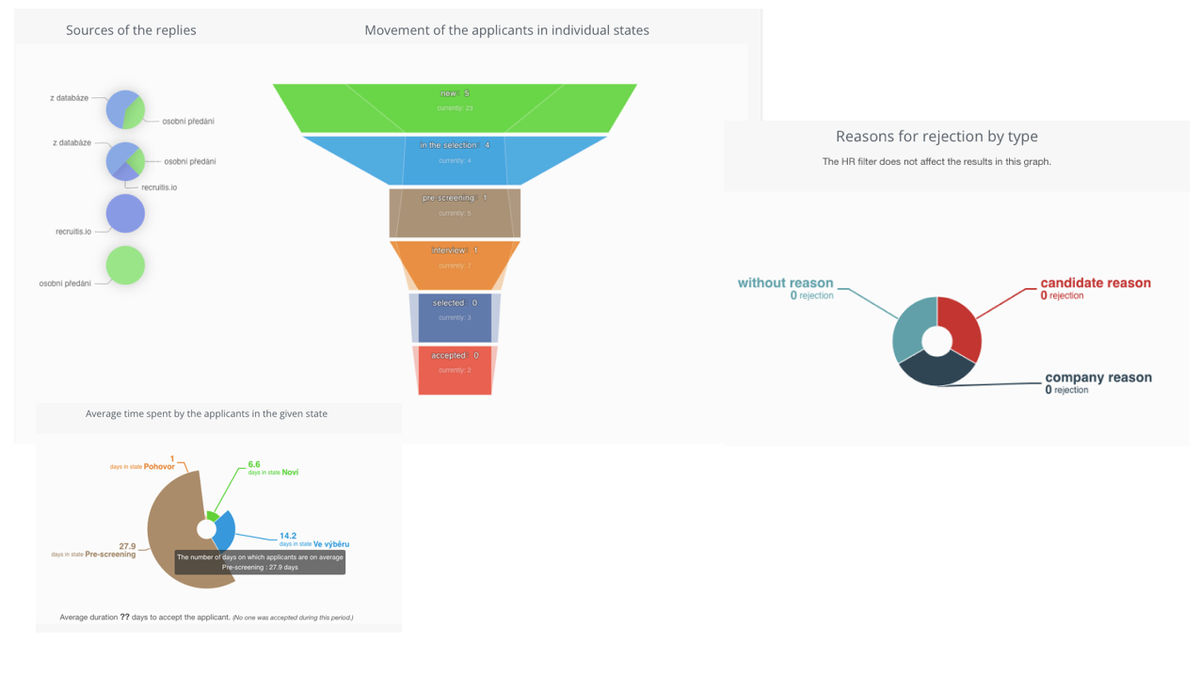
Number of candidates and their resources
In the opening graph in the shape of a funnel, you can see how many candidates passed through the individual stages during the given period (i.e. how many were new candidates, how many candidates passed the interview stage, etc.) and how many candidates are currently there (this affects the shape of the funnel and if some part "swollen" shows that the process is in some place may be overloaded).
If we specifically focus on the first line of the graph, i.e. new candidates, it tells us how many new candidates were added in the given period. While the active ones already show us how many candidates are in a given stage of the process right now.
The following attributes are essential for understanding the chart:
- Bold numbers
- The filtered period applies to them
- They show the number of moves to the given flow states that were made during the given period (e.g. how many times a candidate was moved to the "interview" state, etc.)
- "currently" numbers
- They are not covered by the filtered period - it is the number of candidates who are in that state right now
- Currently" contains both active candidates and rejected ones
- It will usually be the case that the number of candidates "Currently" in a given status is greater than the number of candidates who have been moved to that status in the filtered period
The names, colors and number of funnel items depend on your individual settings and therefore may differ from the example shown. At the same time, the quality of the data affects the explanatory power of the graph - that is, if you skip some steps, repeatedly move candidates to the same state, etc., you can significantly reduce the explanatory power.
For each state, you also see the share of candidates from each source. You can thus monitor not only the quantity of candidates from individual sources, but also the quality. E.g. just because source A brings you the most candidates on entry doesn't mean it's good. If the majority of candidates from this source do not even get an interview, it is worth considering whether to use such a source. On the contrary, if source B gives only a few candidates, but all of them advance to at least an interview, it is a quality source regardless of quantity.Délka náboru
This graph shows how long it takes on average to accept applicants. Again, similar to candidate sources, you can see the detail for each stage of recruitment, giving you another dimension. For example, if you find that it takes 20 days on average to accept an applicant, that can be a good or bad result. The number alone wouldn't tell you much. If, for example, no stage lasts more than a few days, that's probably fine, but if there is, for example, one stage that takes up 15 of those 20 days, you know it needs to be focused on and that speeding it up will speed up your recruitment process dramatically .
Reasons for rejection
Reasons for rejection are important in recruitment from several points of view. In terms of statistics, you are probably most interested in the reason for the most frequent rejections to evaluate the relevance of candidate sources and the quality of communication in recruitment. For example, do you most often reject the company because the candidate was not culture-fit? Then you probably need to consider the places where you advertise, the content and style of your advertising, etc. Do you most often reject the candidate because he had higher financial expectations? Then your offers are probably below the market level.
Gender of candidates
This statistic gives you an overview by gender of the candidates. Thanks to filtering according to recruitment flow, you can monitor the balance for different types of positions.
It follows from the above that statistics will primarily help you identify the key questions you should be asking and the answers to which will help you continuously improve your recruitment process. By the way, these statistics are also displayed in the detail of each position (at the bottom of the page under the list of candidates) with values for that specific position.
Reports
In the reports, you have access to detailed data from the system, which allows you to do a deeper analysis either directly in Excel, by connecting to one of the BI systems, or by programming your own logic for data processing and data visualization.
Within the report, you can choose to generate several types of data, or data from several perspectives. Directly on the report page there is a description of the individual Excel sheets that you can download and also of the individual items, here is a brief overview:
- Timeline
- contains a record of events in the system for the given period
- here you will find data such as: how many interviews there were, how many accepted candidates, how many notes were added
- Answers
- contains a list of candidate responses to your positions for the given period
- you can find out here, for example: how many candidates applied to you, from which sources, what is their current status in the process, whether they were rejected and why, etc.
- Jobs
- contains positions open in the given period
- you will find out whether, for example: how many positions you have opened, how many are active, how many FTEs you are looking for in them, why the positions were opened, etc.
- Job Filters
- contains filter items for positions opened for the given period
- the meaning of these items varies from company to company, so their meaning cannot be described in general, but for example it can be the number of positions for a specific department, division, technology, etc.
- Personalists_Answers
- contains all responses generated in the given time frame with regard to individual HR personnel
- the format is suitable for a contingency table, which can then analyze the activity of individual recruiters, e.g. how many candidates they processed, how many interviews they did, how many offers they made, etc.
- Personalists
- contains an up-to-date list of all system users (this workbook does not apply to a time range)
- Offices
- contains all branches of the company (the time range does not apply to this workbook)
A whole range of metrics, the evaluation method and the meaning of the values depend on your specific settings (mainly on flow recruitment, reasons for rejection or filter items) and also on how honestly you fill in the data (e.g. reasons for opening a position), therefore it is not possible to deliver a single report, which suits everyone and it is also possible that some of the above examples will not be possible with your particular data.Více informací, včetně některých praktických aplikací reportingu, obsahuje následující video:
Related articles
Bulk tagging
You don't have to tag candidates one at a time, but you can add or remove tags from an entire group of candidates.
LinkedIn plugin
Keep an overview of contacted candidates on the LinkedIn professional network and use the option to easily download them directly to ATS Recruitis without the need for rewriting.
Linking new responses from StartupJobs
Use the automated connection with StartupJobs.cz and get notified about new answers.