NPS metric
Why activate the NPS metric?
NPS (Net Promoter Score) is a methodology that is used to measure customer satisfaction with a product or service, in the case of recruitment it is candidate satisfaction with the recruitment process. We firmly believe that nowadays feedback is very important and you will certainly appreciate it when a candidate comments positively or negatively on the recruitment process you have prepared for them. If you get negative feedback, then at least you will know that something needs to be improved in your selection process. If you get positive feedback, it will be a boost of energy for your team.
How does NPS work in ATS Recruitis?
As soon as the candidate ends up in accepted or rejected status, the system automatically sends him an email after two days with the question you set for the given recruitment phase where the candidate ended up.
Learn more about setting options later in this article.
What kind of candidates can you meet?
What kind of candidates can you meet?
- Critics (detractors) - They are not satisfied with the selection procedure and choose values 0-6.
- Neutral candidates (passives) - They do not have a positive or negative opinion, they choose values 7-8.
- Promoters - They are very satisfied with the selection procedure and choose values 9-10.

How is the NPS metric calculated?
The metric can range from -100 to 100, and the higher the number, the more satisfied the candidates were with the selection process. For a better explanation, here is an example:
Let's say we got feedback from 190 candidates and it was:
- 60 critics
- 30 neutral
- 100 promoters
Resulting NPS value = (100-60) / 190 = 21.05%
This example shows that there are 21.05% more candidates who were satisfied with the recruitment than those who were dissatisfied.
Enable NPS measurement
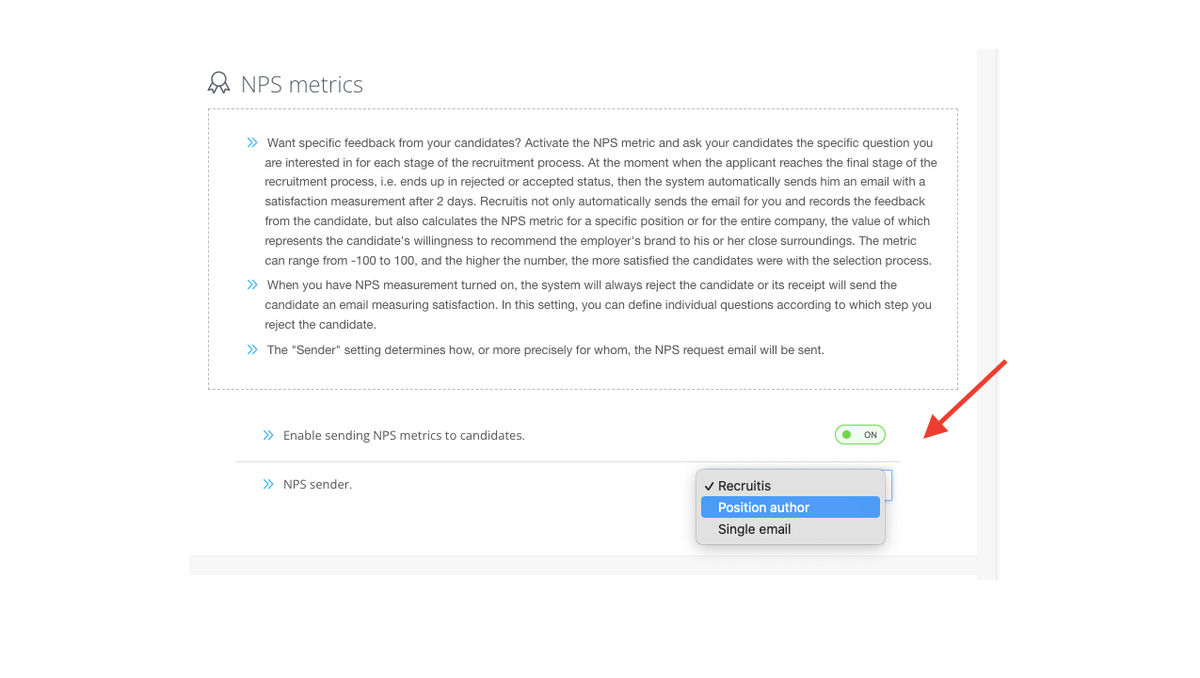
You can turn on NPS measurement in the Settings | menu NPS settings (link).
Right below that, you have the option to set your NPS sender. The sender of NPS can play a significant role on the side of the recipient, i.e. the candidate - if the sender is a recruiter they have met, there is a greater chance that they will provide feedback.
Setting up NPS questions
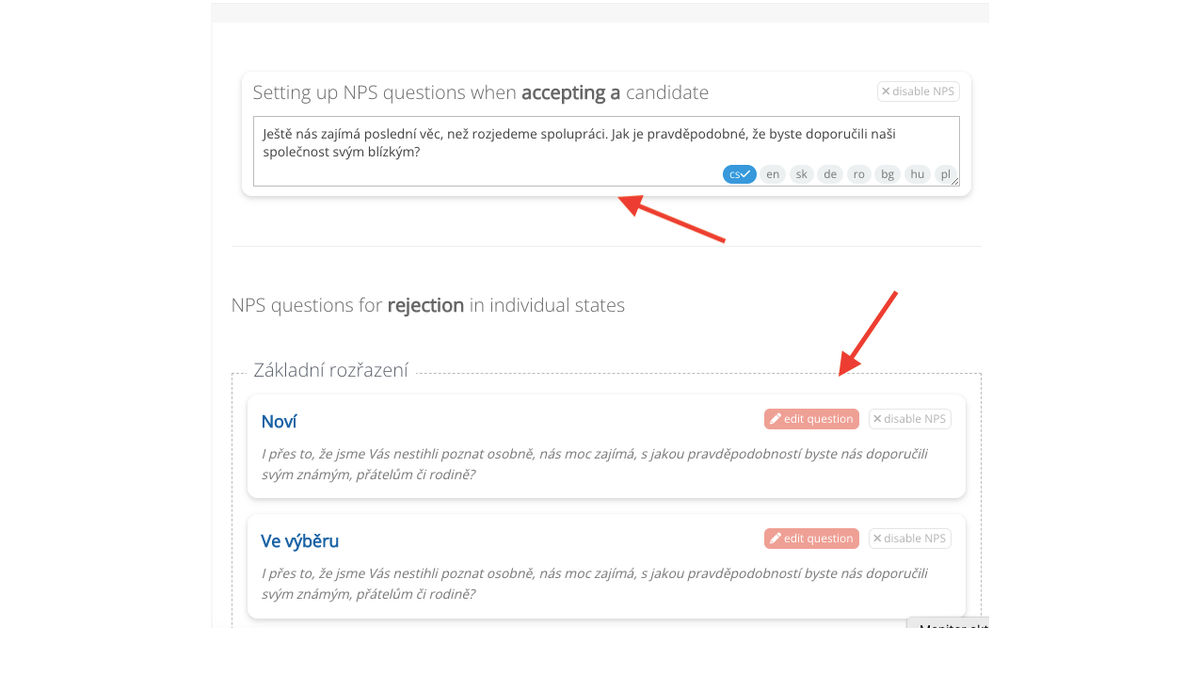
You can also set the questions with which you will ask for feedback in the Settings | menu NPS settings (link).
Here you can edit the NPS questions that you will ask candidates for feedback on applicant acceptance and also for rejection in individual states.
For questions related to rejection in individual states, you can set both the text (in all supported languages) and whether you want to measure NPS at all in the given step.
You set questions for all phases of all flow recruitments that you have set up.
NPS statistics
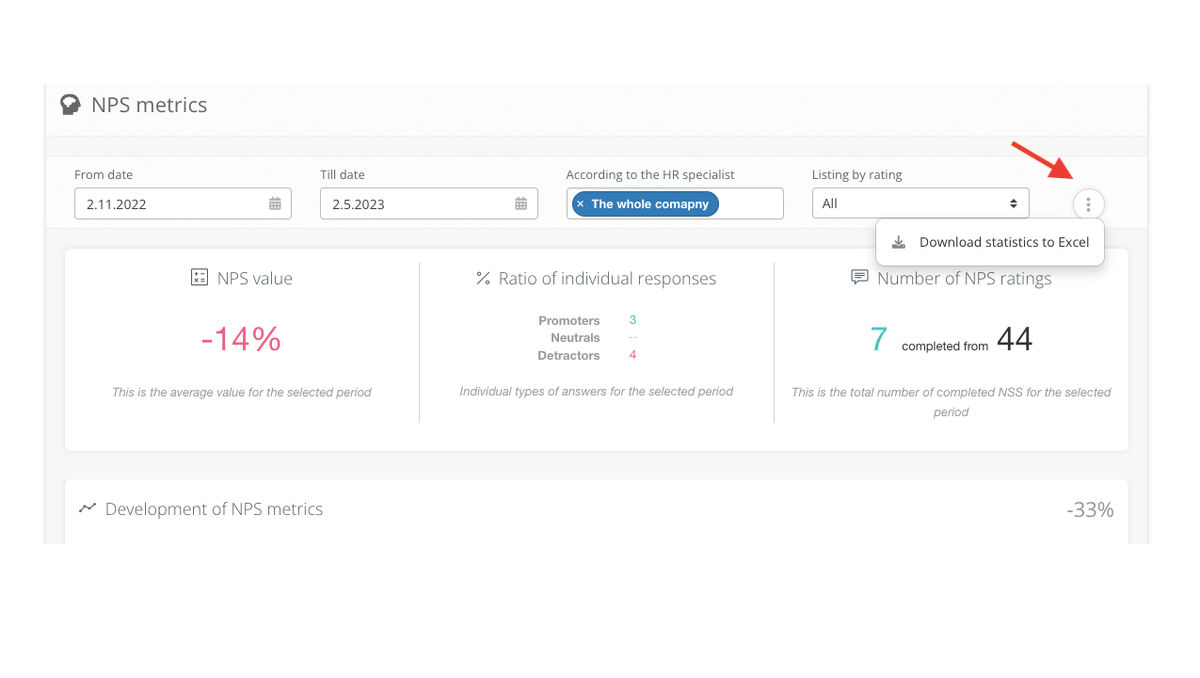
An overview of received feedback can be found on the separate "NPS statistics" page in the Selections menu (link)
You have the option to filter out a specific time period, a colleague and also the type of candidate (e.g. a neutral candidate). You can also download the data to Excel, or follow the development over time through graphs.
Development of the NPS metric
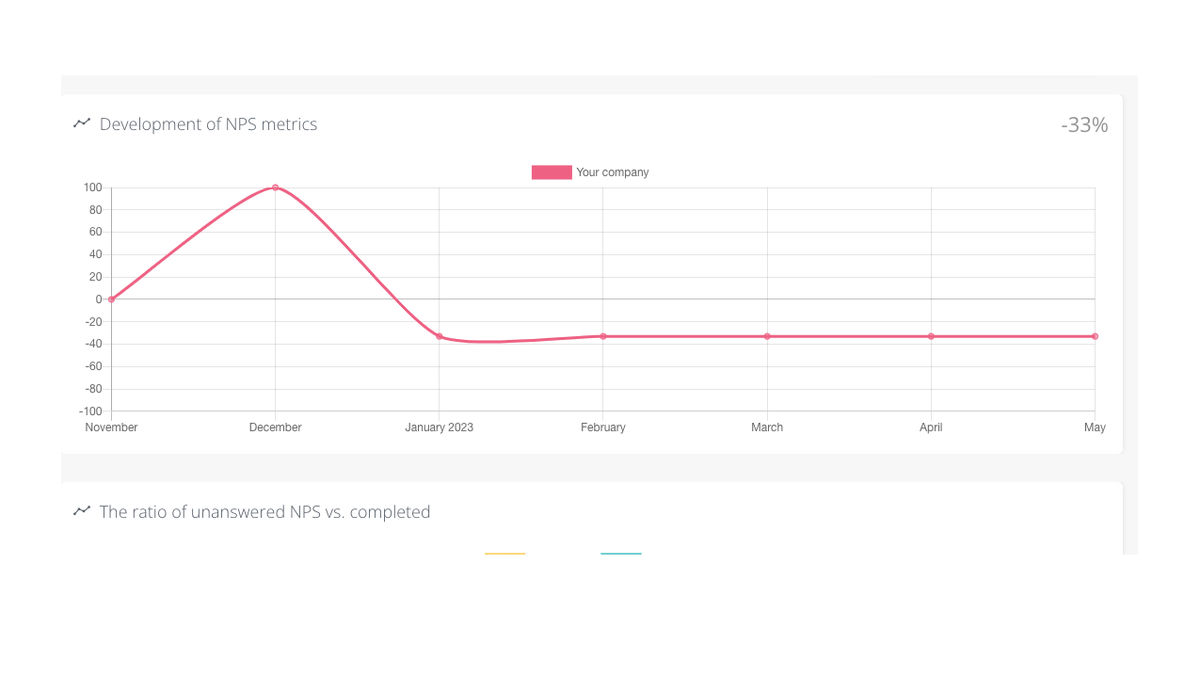
The first graph shows the development of the NPS value calculated by months for the selected time period. The given NPS number is the value for the last displayed month and also shows the trend (whether our values are increasing - green arrow up, or decreasing - red arrow down).
If you turn on filtering for a specific recruiter, the NPS curve for the entire company will remain displayed for comparison.
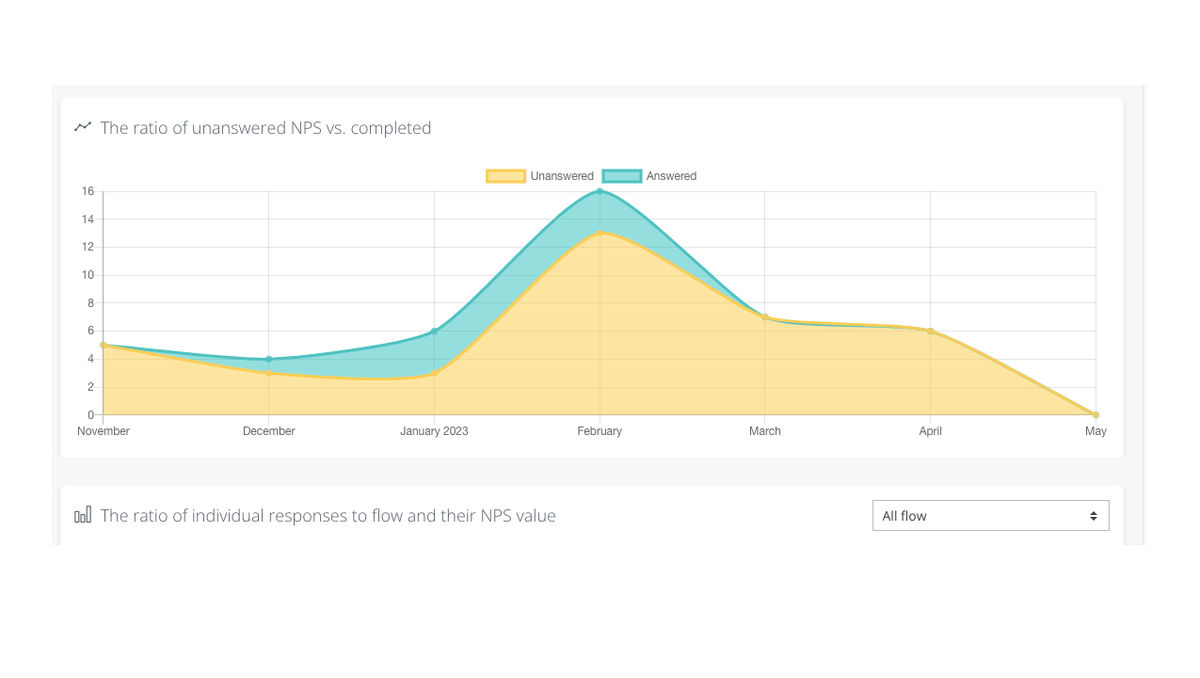
NPS non-response ratio vs. filled out
In the second graph, you can see the ratio of unanswered and completed NPS in a specific time period. Visually, you can see at a glance whether the response rate is increasing or decreasing. This is especially important if you are actively focused on increasing your returns and want to see your progress.
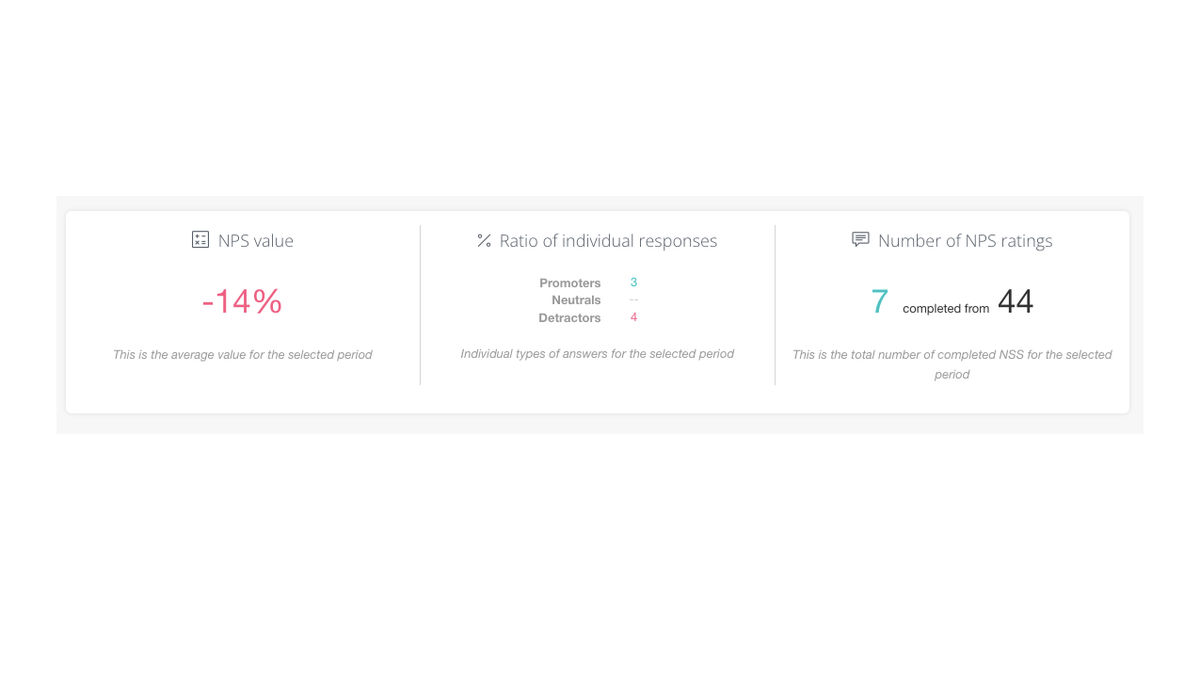
NPS value and number of NPS ratings
The NPS value is the average value for the selected period. You can find the calculation at the beginning of this article.⬆️
💡Wondering what the difference is between the NPS value and the value in the first chart "The Evolution of the NPS Metric"? The difference is big! The percentage value in the development of the NPS metric indicates the NPS value for the last month in the selected period, and the graph shows the values for individual months, while the NPS value is the overall average of all responses for the entire period. In other words, the average of the values for individual months in the opening graph is not equal to the average for the entire period.
Next to the right of the NPS value, we can see the number of NPS ratings, where the total number of completed NPS for the selected period is displayed.
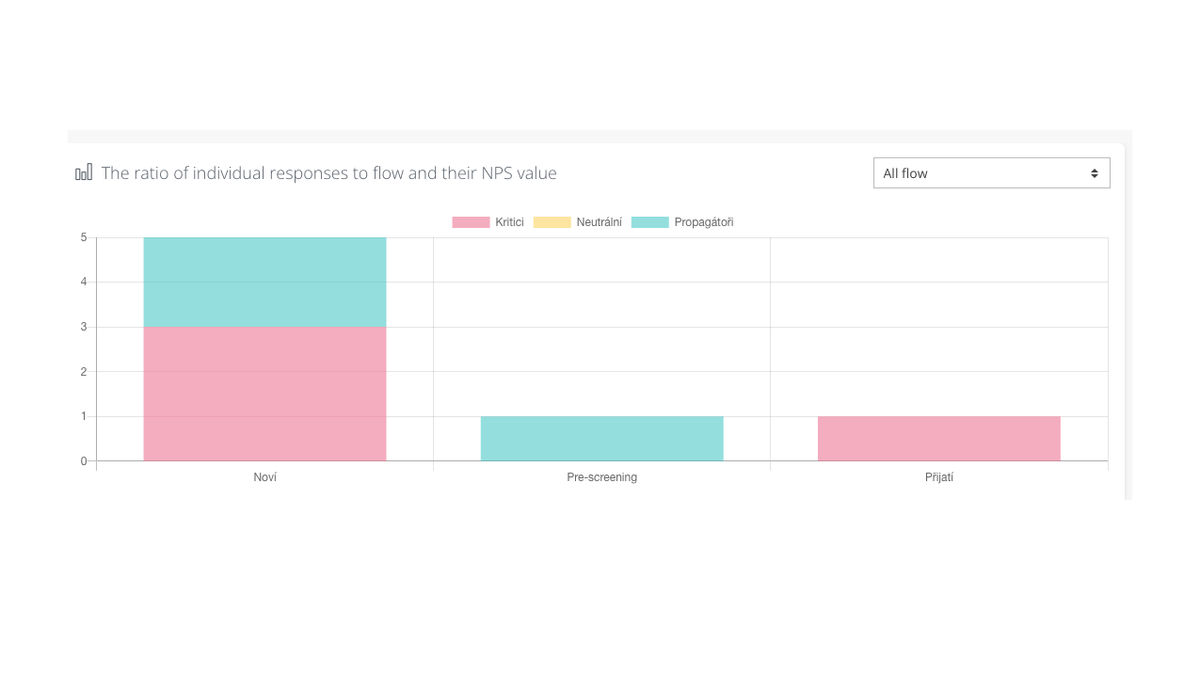
The ratio of individual responses to flow and their NPS value
This graph is used to display the ratio of individual response types to flow. The candidates are sorted: in red - critics, in yellow - neutral, in turquoise - promoters. Flow can be filtered for all flows or just one specific flow. Primarily here, we see values from all states of all flows so that we are able to identify problematic phases of the recruitment process (i.e. those where critics prevail).
💡The collected data clearly show us the share of critics, of which there are naturally more at the beginning of the process (i.e. mainly in the "New" state) and gradually their share decreases. But if you see, there is still a large part of critics in the "interview" type stages, you need to focus on this stage and reduce this proportion.
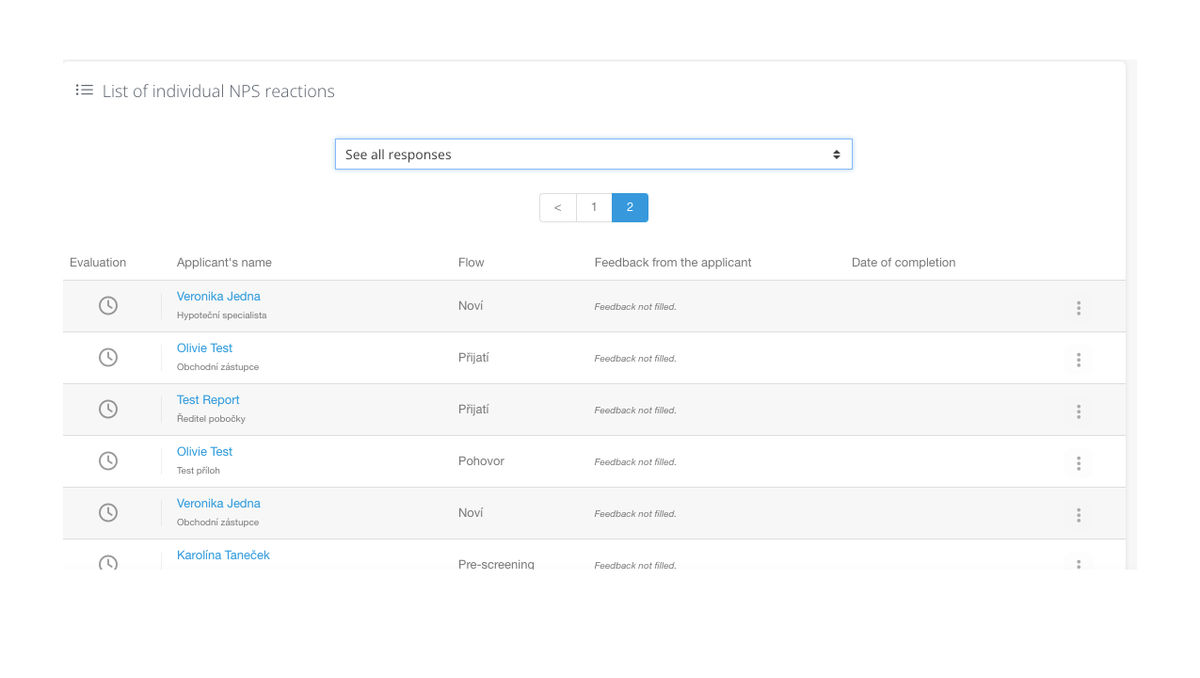
List of individual NPS reactions
Finally, we are shown a list of individual NPS reactions, where you can see the evaluation score, applicant's name and surname, flow, feedback and date of completion. However, you can filter whether you want to see all reactions, reactions with ratings only, or reactions with ratings and feedback. On the right after the three dots, you have the option to change the recruiter to which the NPS is assigned.
💡 If you can download the NPS data into Excel, it also contains these values, including other details, and you can then analyze the data more carefully.
Related articles
Bulk tagging
You don't have to tag candidates one at a time, but you can add or remove tags from an entire group of candidates.
LinkedIn plugin
Keep an overview of contacted candidates on the LinkedIn professional network and use the option to easily download them directly to ATS Recruitis without the need for rewriting.
Linking new responses from StartupJobs
Use the automated connection with StartupJobs.cz and get notified about new answers.