Calculation of the reaction time between each flow state
Procedure for calculating the reaction time
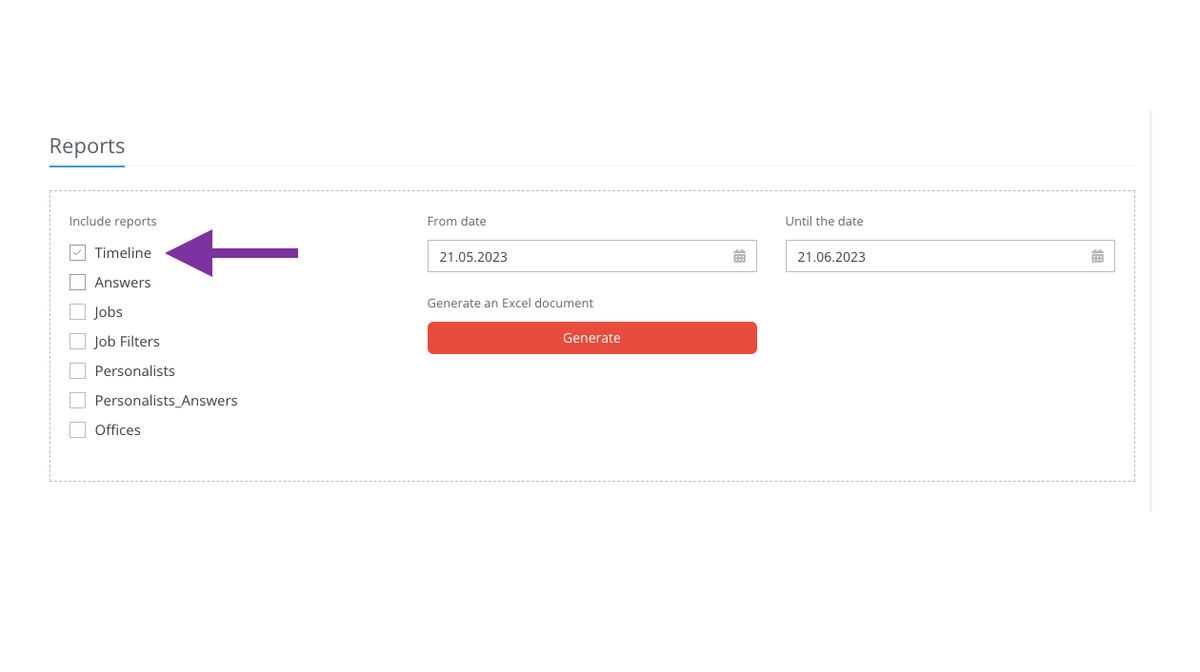
The data for this calculation can be found in the menu Selections | Reprots link
The procedure is as follows:
- select the "timeline" tab from the report selection
- we define the time period for which we want to get the report
- generate an excel document and open it
💡The "timeline" workbook contains a record of events that have taken place in the system during the given period. It gives you the data needed for calculations such as: how many interviews took place, how many candidates were accepted, how many notes were created, etc.
Working with excel document
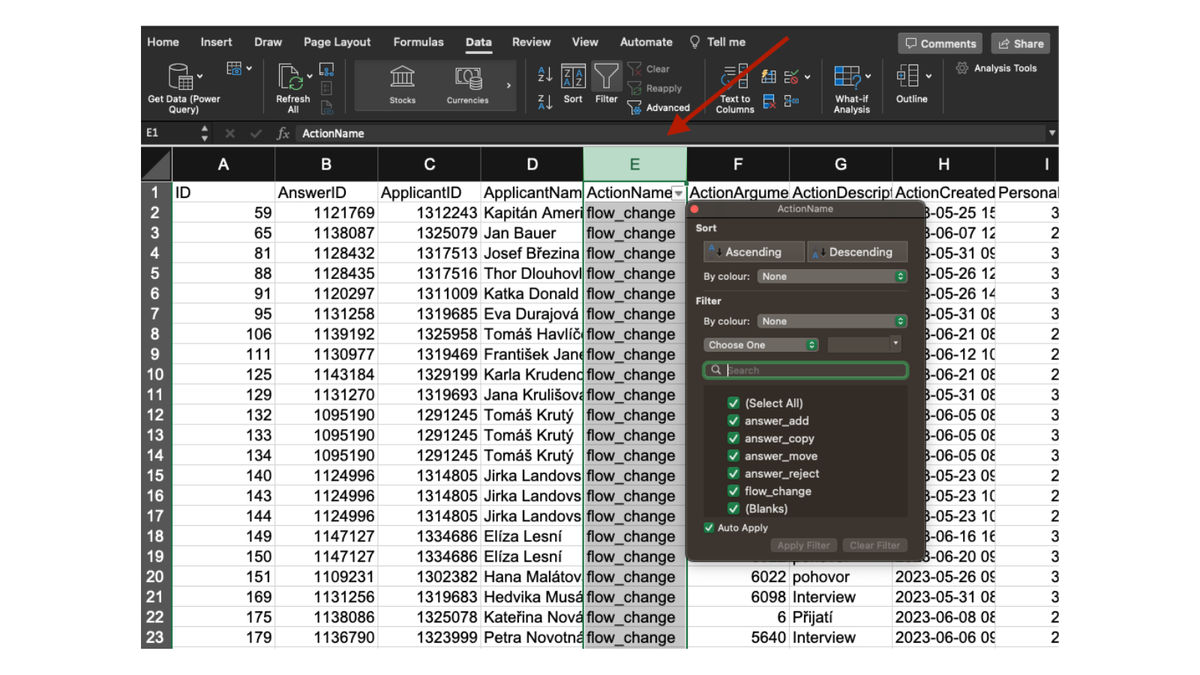
1. In the column "ActionName"(action that was executed) filter the following:
-
- "answer_add" - adding a candidate to the position (candidate has applied)
- "answer_copy" - a copy of the answer (the recruiter copied the candidate to another position)
- "answer_move" - moving the answer (the recruiter has moved the candidate to another position)
- "answer_reject" - zamítnutí
- "flow_change" - state change in flow
Once these positions have been filtered, only the data that relates to the candidate's emergence into the position, the shift between recruitment phases and rejection will be available. The calculation will not include the times of sending an email, adding a note, etc.
💡In order for the formulas to work correctly and the report to contain only this data, it is necessary to copy the result of the filtering into a new workbook so that there are no "gaps" in the data caused by not displaying the unfiltered values, which would cause the formula below to not work.
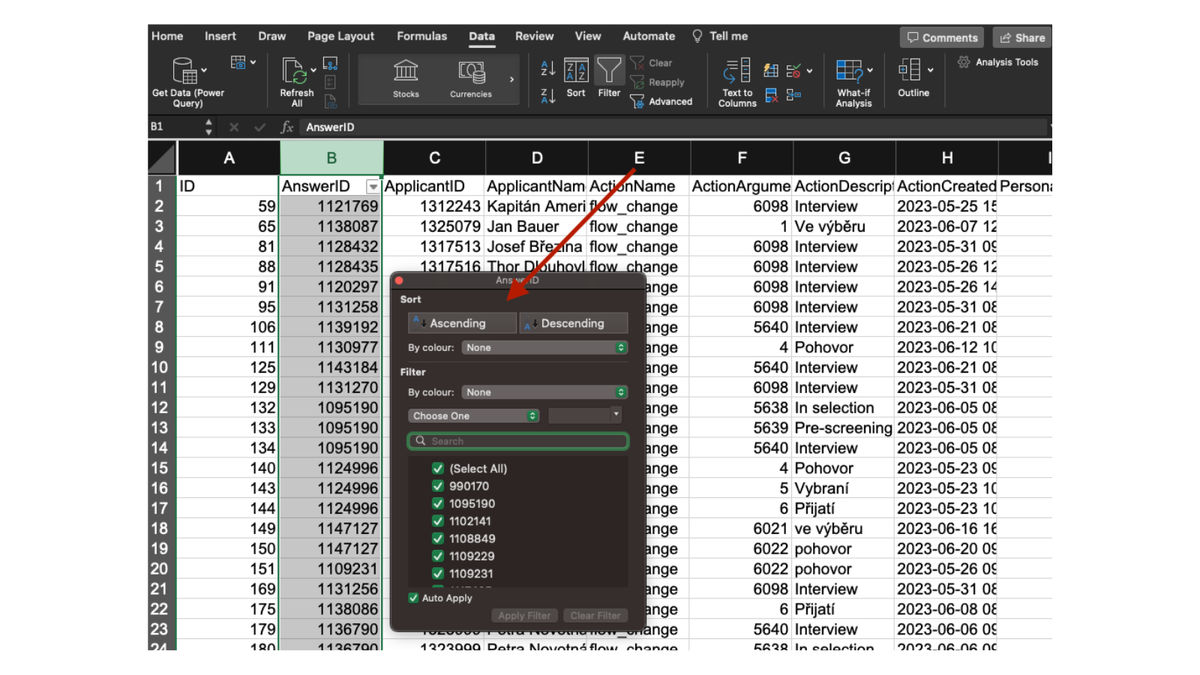
2. Sort the listing by "AnswerID" (candidate identifier)
-
- the chronological data will be sorted, grouped by each candidate's position (if a candidate has applied for multiple positions, there will be multiple "groups" of data
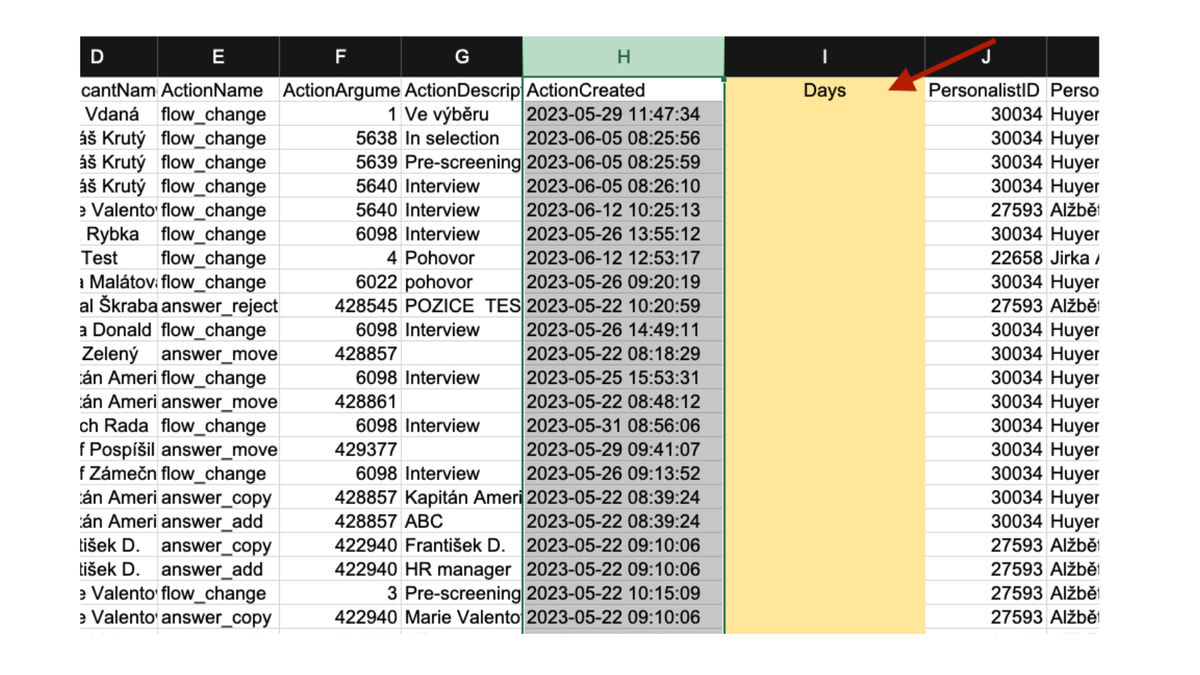
- insert a new column into the table, which will be used to calculate the duration between states, in our case we will call it e.g. "days"
💡All actions with one candidate will be chronologically ordered from the origin of the answer to the last move. This way it will be possible to count how long each action took line by line.
3. Formula for calculating the value
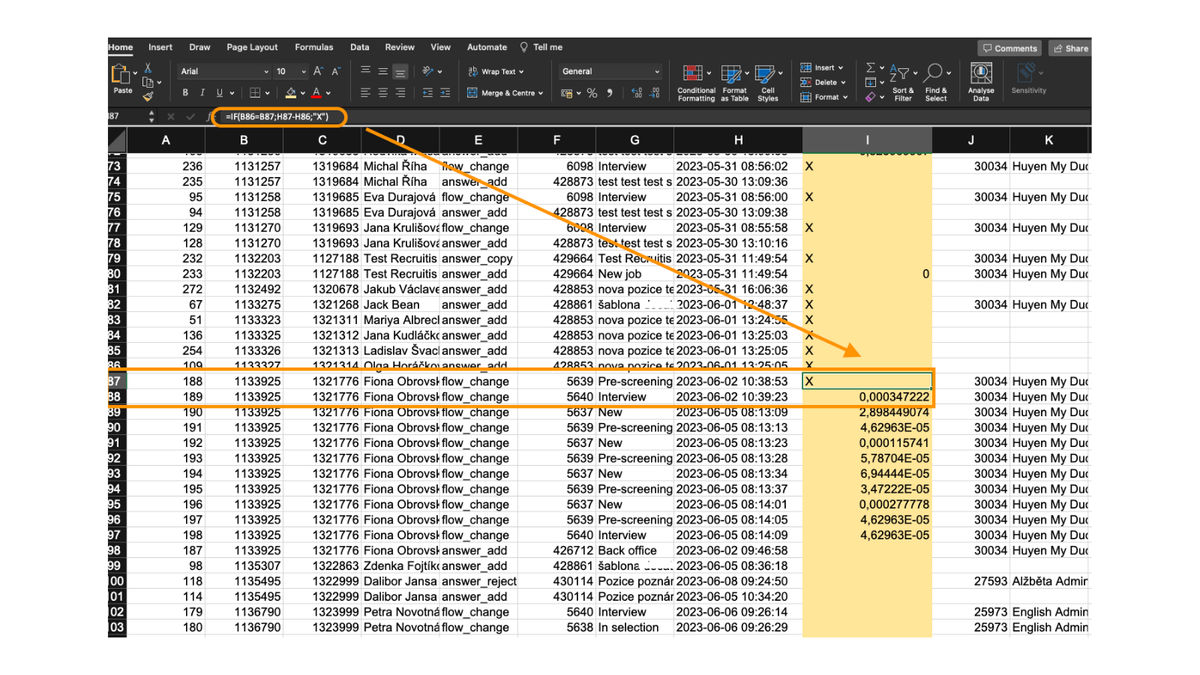
The formula is used to calculate the value between adjacent rows (i.e. actions. For our calculation it is necessary that the actions belong to one candidate (satisfied condition), otherwise "X" will be shown (unsatisfied condition).
=KDYŽ(B2=B3;H3-H2;"X")
in the English version of MS Excel it is then: =IF(B2=B3;H3-H2;"X")
You set the formula on the second row to calculate the values for the first and second rows and then just copy to the entire range of rows in the workbook.
💡During the reporting period, there are likely to be events with candidates who have emerged in the past. It should be taken into account that the calculation may not cover all actions for all candidates (typically, for some candidates you will have, for example, only one action in the filtered period, e.g. rejection, and then it is not possible to calculate the duration of this state
💡It is therefore important to have the right range of data for the report, i.e. both the origin of the response and the shift between actions.
The figure below shows a sample result of such a calculation:
Related articles
Bulk tagging
You don't have to tag candidates one at a time, but you can add or remove tags from an entire group of candidates.
LinkedIn plugin
Keep an overview of contacted candidates on the LinkedIn professional network and use the option to easily download them directly to ATS Recruitis without the need for rewriting.
Linking new responses from StartupJobs
Use the automated connection with StartupJobs.cz and get notified about new answers.